Visualising sound 08
Microphone polar pattern diagrams
- Video
- Script
Welcome to this tutorial on microphone polar pattern diagrams.
The polar pattern diagram is used to show the sensitivity of a microphone to sound arriving at its capsule from different directions. They are primarily used by microphone manufacturers and displayed in a microphone's manual or technical specification.
They can help us decide whether or not to purchase a microphone, and also to determine the best microphone to use for a recording.
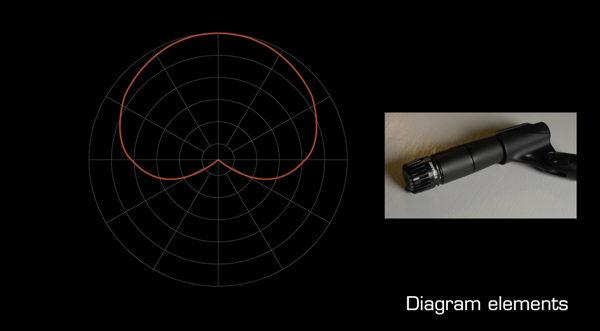
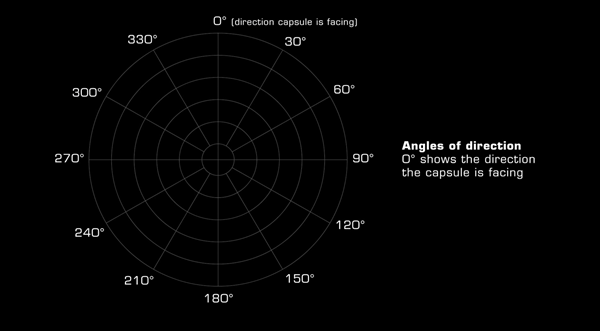
Caption - Diagram elements
The polar pattern diagram takes the form of a two-dimensional contour map showing the microphone's output at different angles of incident of a sound wave.
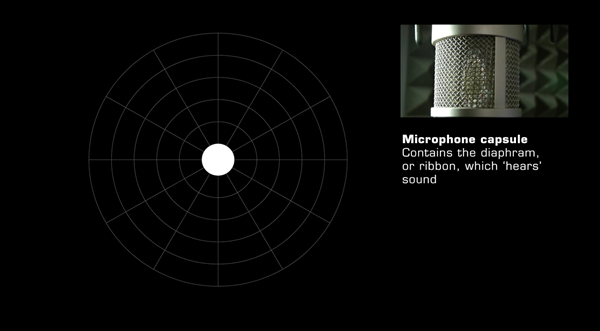
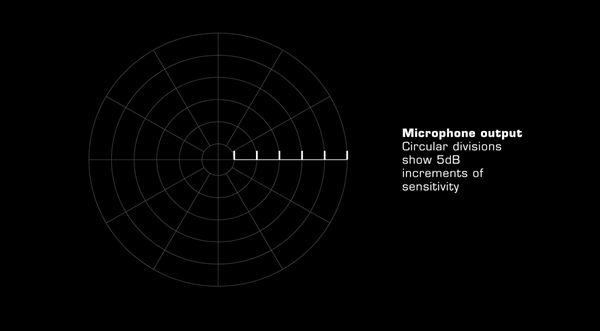
The centre of the diagram represents the microphone's capsule. This point is surrounded by a series of concentric circles which function as a scale with which to plot the output of the microphone. This scale is variable but typically shows 5 decibel increments.
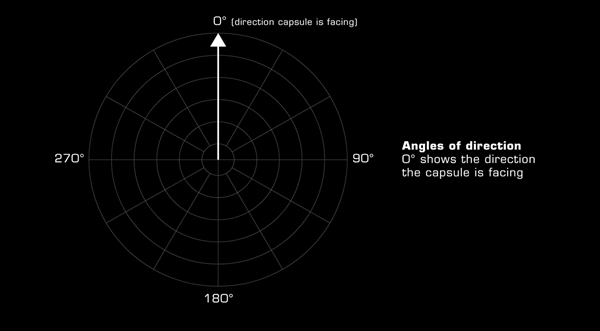
0 degrees indicates the direction in which the capsule in facing, which is usually the angle at which it is most sensitive to sound and produces the greatest output.
The sides of the microphone are shown at 90 and 270 degrees, and it's back at 180 degrees.
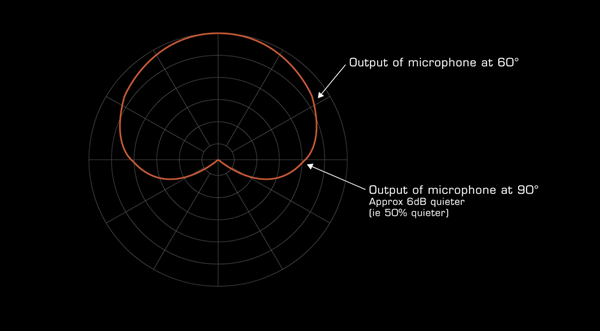
A thick line plots the pattern of sensitivity. This plot is created by playing a test tone at a reference level through multiple loudspeakers which surround the microphone. The plot therefore shows how well the microphone picks up sound from all directions. The greater the plot from the centre the greater the output of the mic at that angle.
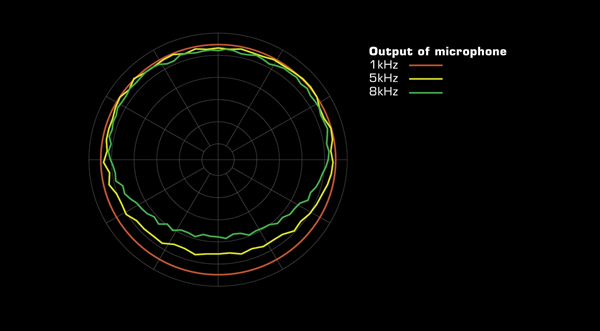
Because a microphone's sensitivity can change according to frequency, the diagram may show different plots for different reference tone frequencies. Typically these will be at a range of frequencies such as 8kHz, 1kHz, and 200Hz.
Caption - Common polar patterns
The plot of sensitivity for a given microphone will depend on it's design, characteristics and quality. Most plots show variations on 6 common designs.
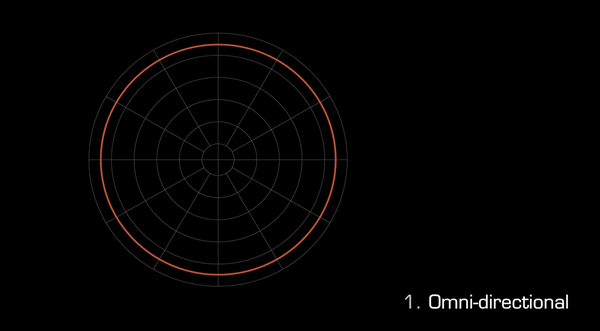
Caption - 1. Omni-directional
The omni directional microphone is designed to be equally sensitive to sound arriving from all directions.
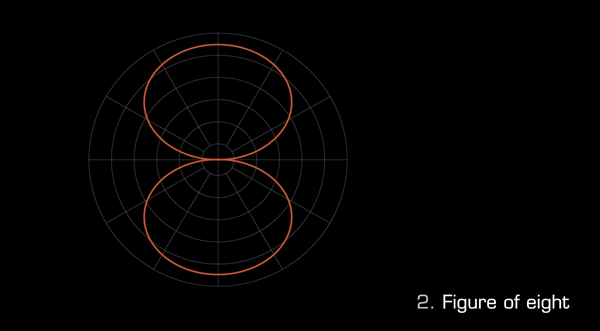
Caption - 2. Figure of eight
The figure of eight microphone is designed to be equally sensitive to sound arriving from the front and rear.
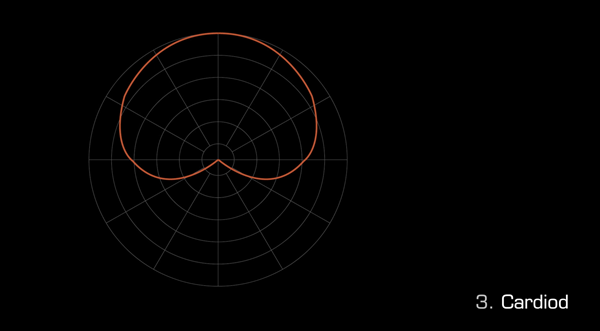
Caption - 3. Cardioid
The cardioid microphone is designed to be sensitive to sound arriving from a wide range of angles at the front.
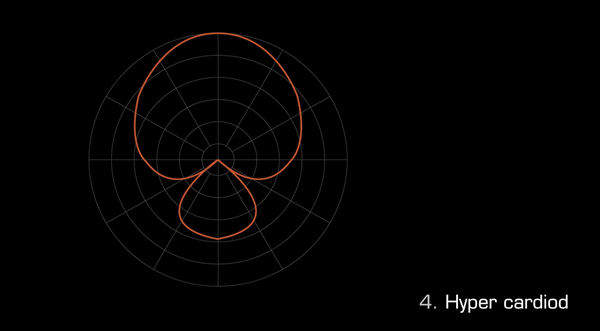
Caption - 4. Hyper cardioid
The hyper cardioid microphone is designed to be sensitive to sound arriving from a still narrower range of angles at the front.
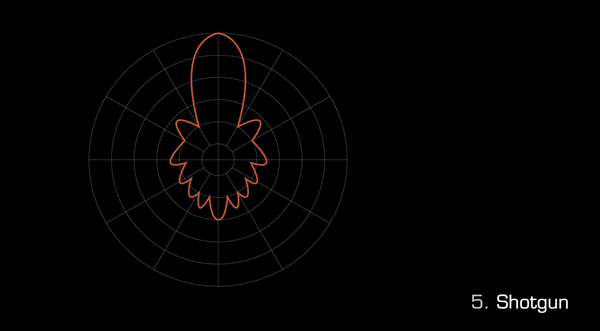
Caption - 5. Shotgun
The shotgun microphone is designed to be sensitive to sound arriving from a distance at a very narrow range of angles.
Caption - Thanks for watching
The script for this video, with accompanying images, can be found at projectstudiohandbook.com
We suggest you subscribe at our YouTube channel, and join our mailing list at our website to receive notification of new videos, blog posts and subscriber only extras.
Thanks for watching.